
Location level response metrics are the per-location measures that tell you whether a specific business site is replying to Google reviews well: response rate, time-to-first-response, and response rate by star level are the three that matter most. Pull the raw numbers from Google Business Profile review fields, then combine them with your own workflow system to capture approval states Google never reports. The immediate task is simple: start storing locationId, reviewId, and reply update timestamps for every review, at every location, starting today.
TL;DR:
- Ensuring response metrics are accurate requires capturing review reply response times based on reply
updateTime, not review edit times, to avoid misleading response speed data.- Response rate measurements should be fixed at a specific cutoff date, with explicit definitions of eligible reviews to prevent denominator drift and inconsistent comparisons across locations.
- Collecting detailed review data including
reviewId, creation, update, and reply timestamps, along with workflow status, is essential for reliable, actionable location-level response analysis.- Response rates differ significantly by star level, especially for one- and two-star reviews, which pose higher reputational risks when left unreplied or slow to respond.
- A practical dashboard for operations should include response rates, median and 90th percentile response times, unresolved review counts, and workflow approval data to support effective coaching and process improvements.
Table of Contents
- What Are Location-Level Response Metrics, Exactly?
- How to Collect the Data Reliably From Google's APIs
- Measurement Pitfalls That Quietly Wreck Your Numbers
- Building a Scorecard and Dashboard That Ops Teams Will Actually Use
- Implementation Checklist for Rolling This Out
- Why Per-Location Consistency Changes How You Coach Teams
- Where Local Review Reply Fits Into This Scorecard
- Sources
- FAQ
What Are Location-Level Response Metrics, Exactly?
A single company-wide reply rate hides more than it reveals. A 92% response rate across 40 locations might mean every site is doing fine, or it might mean two locations are ignoring reviews entirely while the rest carry the average. Location-level response metrics split that number back out by physical site, so operations teams can see exactly where the problem lives.
Here's what a defensible scorecard tracks for each location:
- Response rate — replied reviews divided by eligible reviews. "Eligible" needs its own definition (more on that below), but generally it means reviews received before your reporting cutoff that are still active and not removed for policy violations.
- Time-to-first-response, measured both as a median and an average, plus the 50th and 90th percentiles. The median tells you the typical experience; the 90th percentile tells you how bad your worst cases get. A location with a 4-hour median and a 12-day 90th percentile has a very different problem than one with both numbers close together.
- Response rate by star level — split into 1 to 2 stars, 3 stars, and 4 to 5 stars. Low-star reviews carry more reputational risk, so a location replying to 95% of five-star reviews but only 40% of one-star reviews is quietly accumulating damage.
- Unresolved-review count and average age — how many reviews sit unanswered right now, and how long they've been waiting.
- Workflow KPIs: drafts awaiting approval, approval rate, reject/edit rate, and posting failure rate. These come from your internal system, not from Google.
How to Collect the Data Reliably From Google's APIs
The metrics above only work if the underlying data collection is consistent across every location. Google's review resource exposes the fields you need: reviewId, createTime, updateTime, starRating, comment, and a nested reviewReply object containing the reply text and its own updateTime. Store all of these, not just the review text, because Google's review resource documentation treats the reply's update time as a separate field from the review's own update time, and that distinction matters for calculating response speed correctly.
For multi-location retrieval, batchGetReviews can pull reviews for up to 50 verified locations in a single call, and results come back paginated rather than all at once. Any pipeline pulling data for more than 50 locations needs to loop through batches and handle nextPageToken correctly, or it will silently miss locations. Google's batchGetReviews method documents the default page size and pagination behavior, and it's worth reading closely before writing your first pull job.
A few things to lock down before you write a single line of ETL code:
- Store
reviewReplyStatealongside the reply itself. A review can have a reply object present but not yet published. - Keep both
createTimeandupdateTimefor the review, separate from the reply's ownupdateTime. Conflating them corrupts time-to-response math. - Confirm every location is verified. Google requires verification before a business can reply to reviews at all, per Google Business Profile's review management help page, and unverified locations either return errors or incomplete data.
- Set up OAuth scopes correctly for the Business Profile APIs before the first production run, not after a failed pull.
Measurement Pitfalls That Quietly Wreck Your Numbers
Most bad location scorecards aren't wrong because of bad intentions. They're wrong because of denominator drift, and denominator drift is boring enough that nobody catches it until leadership asks why last month's numbers changed.
- Freeze your denominator at the report cutoff. If you calculate "reviews received this month" using a live query that keeps updating as new reviews trickle in, your response rate for the same reporting period will look different depending on when you happen to run the report. Snapshot the eligible-review count once, at a fixed cutoff, and don't recalculate it retroactively.
- Define "eligible review" explicitly and stick to it. Decide whether removed, flagged, or policy-violating reviews count, and apply that rule identically across every location.
- Treat edited reviews as updates, not new events. A star-rating edit on an existing review should update the existing row by canonical
reviewId, never insert a duplicate. - Report median next to mean, and add a 90th percentile. A single average can hide a long tail of slow replies that's dragging down customer experience at one specific location while looking fine in aggregate.
- Calculate response time from the reply's
updateTime, not from the date you happened to collect the data. Using collection date as a proxy makes old reviews with fresh replies look like brand-new fast responses, which is backwards.
Pro Tip: Before trusting any dashboard, pull the 10 most recent reviews from five or six different locations and manually check the math by hand. It takes twenty minutes and catches almost every mapping error before leadership sees a wrong number.
Building a Scorecard and Dashboard That Ops Teams Will Actually Use
A location scorecard earns its keep only if the row structure is consistent everywhere it's viewed. Six fields cover almost every conversation you'll have with a regional manager or franchise owner:
- Response rate (overall, current period)
- Median time-to-first-response and 90th percentile time-to-first-response
- Response rate by star bucket (1 to 2, 3, 4 to 5)
- Unresolved-review count and average age of unresolved reviews
- Drafts awaiting approval and approval rate
- Reject/edit rate and posting failure rate
For visualization, a small-multiples table works best when you're comparing 20, 50, or 200 locations at once, since it lets a manager scan for outliers in seconds rather than clicking through individual reports. A map view helps when response quality clusters geographically, which happens more often than teams expect when one region has a staffing gap or a language barrier. Whatever the format, build a drill path so clicking a slow location jumps straight to its list of unreplied reviews, not to a generic filter screen.
Google's own reportInsights endpoint returns metric values broken out by location for a requested time range, which is useful for cross-checking your own pipeline's numbers against Google's aggregation, though some insights calls cap how many locations you can request at once.
On cadence: operations teams need something close to real-time, since a slow reply at hour six is still fixable. Leadership needs a weekly rollup. Set your operational SLA (say, first response within a set number of hours) tighter than your leadership-facing target, since the leadership number is a trend indicator, not a daily fire alarm.
Implementation Checklist for Rolling This Out
Getting from "we have an idea" to "we trust this dashboard" is a sequencing problem more than a technical one. Here's the order that avoids the most common false starts:
- Verify every Business Profile location and confirm OAuth scopes cover both reading reviews and posting replies. Skipping this produces silent gaps in your data, not obvious errors.
- Build batch retrieval using
batchGetReviews, storing canonicalreviewId, all four timestamps (createTime, reviewupdateTime, replyupdateTime, and collection time), andreviewReplyStatefor every record. - Add internal workflow events tied to
reviewId: draft created, submitted for approval, approved and published, or rejected. This is the layer Google can't give you, and it's the layer that explains why a location's numbers look the way they do. - Freeze reporting cutoffs, schedule the ETL job on a fixed interval, run a manual sample validation on each rollout, and write down your metric definitions somewhere every stakeholder can find them.
Why Per-Location Consistency Changes How You Coach Teams
Comparing locations fairly only works when every site is measured the same way, using the same denominator rules and the same clock. Skip that step and you'll end up coaching a manager for a slow response time that was actually a measurement artifact, not a real performance gap.
In practice, the sites that score poorly usually aren't understaffed reply teams; they're stuck behind an approval bottleneck, missing a policy-compliant response option for a specific complaint type, or simply unaware a review came in. Tools that draft replies automatically while keeping a human approval step for sensitive or low-star reviews, Local Review Reply among them, can widen response capacity without removing the oversight that protects brand voice.
— Ryan
Where Local Review Reply Fits Into This Scorecard
Local Review Reply is built around the exact gap Google's own APIs leave open: the workflow layer. Where the Google Business Profile fields tell you what happened to a review, Local Review Reply tracks what happened inside your team before that reply ever posted, drafts awaiting approval, time spent in approval, and the published reply timestamp your scorecard needs.
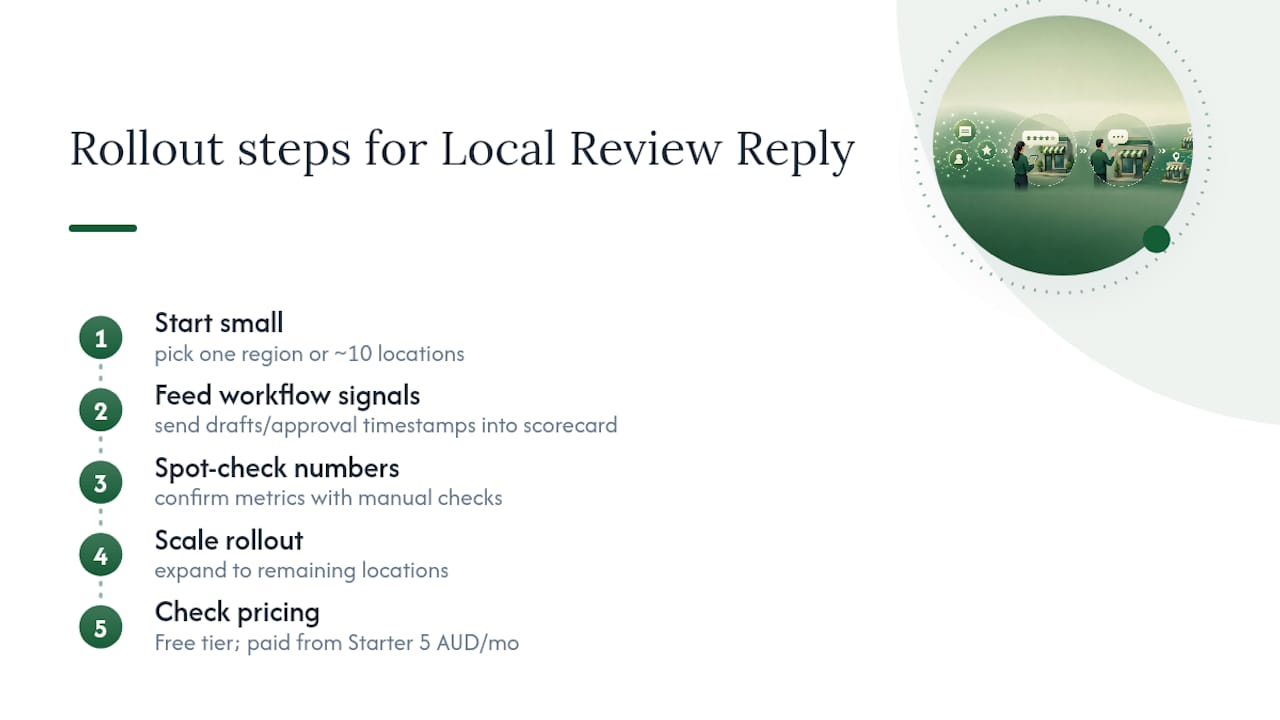
The software drafts replies for Google Business Profile reviews with approval controls that keep sensitive and low-star reviews in front of a human before posting. For franchises and agencies managing multiple locations, that combination aims to improve coverage while maintaining brand-voice consistency. If you're rolling this out, start small: pick one region or roughly 10 locations, feed those workflow signals into the scorecard structure above, confirm the numbers hold up under a manual spot check, then scale to the rest of your locations. Check the Local Review Reply pricing page for current plan options, including a Free tier and paid plans starting at Starter for 5 AUD per month, before deciding how wide to roll it out.
Sources
Three Google resources cover almost everything the pipeline above depends on:
- REST Resource: accounts.locations.reviews | Google Business Profile APIs | Google for Developers
- Manage customer reviews - Google Business Profile Help
FAQ
What Counts as an "Eligible Review" for Response Rate?
An eligible review is any review received before your reporting cutoff that hasn't been removed for a policy violation. Teams should define this rule once, in writing, and apply it identically to every location so response rates stay comparable.
Should I Use Median or Average for Time-to-First-Response?
Report both, plus a 90th percentile. Median shows the typical customer experience, while the 90th percentile exposes the slow outliers a plain average can hide, a distinction Google's own measurement guidance backs for operational alerting.
How Many Locations Can I Pull Reviews for in One API Call?
Google's batchGetReviews method supports up to 50 verified locations per call, returned in paginated results. Larger portfolios need a looping pipeline that tracks pagination tokens across batches.
Does Google Track Internal Approval Workflow Metrics?
No. Google's APIs expose review and reply data, not internal approval states, so drafts awaiting approval, approval rate, and rejection rate have to be captured by your own management system, a gap tools like Local Review Reply are built to fill.
What's the Difference Between Review Update Time and Reply Update Time?
Review updateTime reflects changes to the customer's review itself, such as an edited star rating. Reply updateTime reflects when your team's response was posted or edited, and calculating response speed requires keeping the two separate rather than collapsing them into one timestamp.