
Low star review analytics is the practice of extracting recurring themes from your 1 and 2 star reviews and ranking those themes by how much they're actually dragging down your rating. It's not sentiment tagging, and it's not reading through complaints at random. It's a structured process that tells you which three problems, if fixed, would move your average the most.
If you're staring at a fresh wave of bad reviews right now, skip the theory and do three things today. Export every 1 and 2 star review from the last 60 to 90 days, run a quick cluster pass to group them by complaint type, and sort those clusters by how often they appear, combined with how severe each one is. Then decide, cluster by cluster, whether it needs an engineering hotfix, a policy change, or just a better public reply.
While you're in that export, check one number: your NRV Ratio (negative review velocity, the share of recent reviews landing at 1 or 2 stars). If that share is climbing to a high proportion of recent volume, you have more than a bad week. You have a pattern.
- Export 1 to 2 star reviews from the last 60 to 90 days
- Cluster by complaint type and count frequency
- Rank clusters by severity, then decide fix vs. reply
Key Takeaways
Low star review analytics works because it replaces guesswork with a ranked list: which complaint themes, fixed first, move your rating the most.
| Point | Details |
|---|---|
| Check NRV Ratio weekly | Flag at moderate negative share in a recent window; escalate above a high threshold. |
| Rank by impact, not volume | Severity times recency times reviewer weight beats raw complaint counts. |
| Use ABSA over plain sentiment | Aspect-level tagging separates fixable defects from simple preferences. |
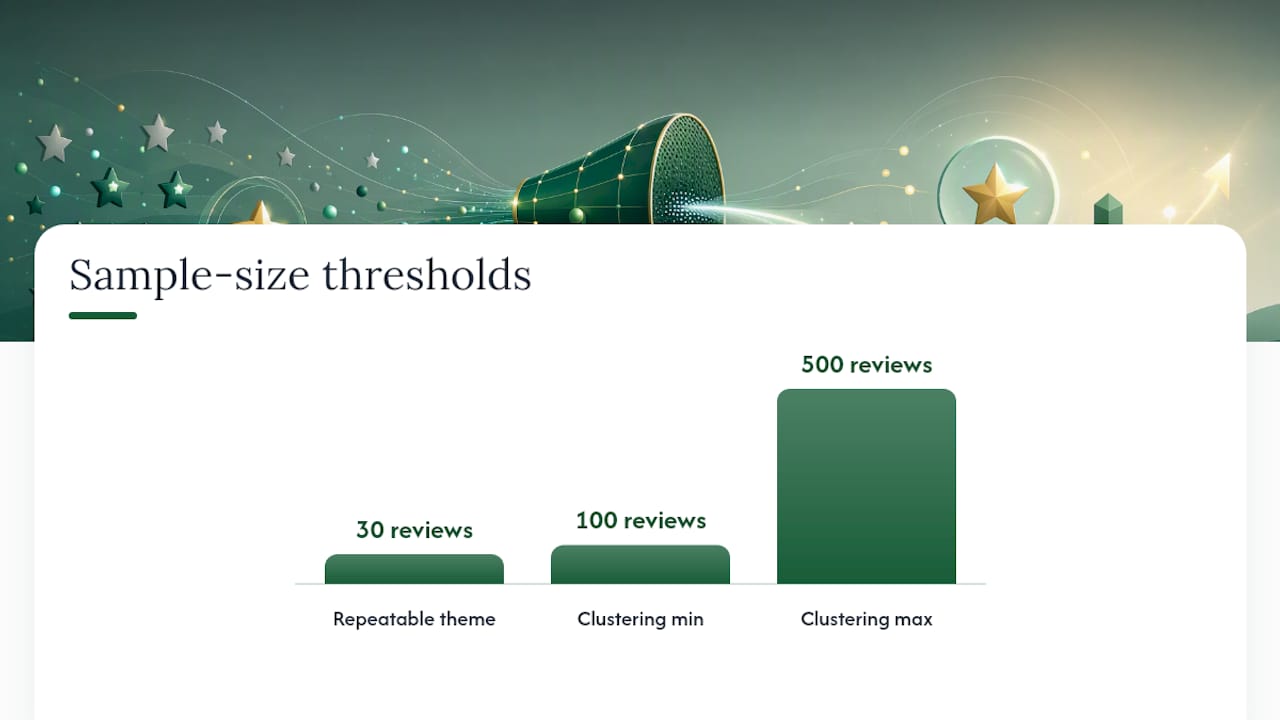
| Need 30+ reviews per theme | Treat clusters under 30 mentions as directional, not confirmed. |
| Close the loop with replies | Localreviewreply drafts on-brand, approval-gated replies for low-star reviews across locations, pairing analysis with response at scale. |
Table of Contents
- What Is Low Star Review Analytics and Why Averages Miss the Real Story?
- Which Metrics Should You Track for Low Star Review Health?
- Sentiment Scores Alone Won't Tell You What to Fix
- How Do You Turn Review Clusters Into a Prioritized Fix List?
- How Local Review Reply Fits Into a Low Star Analytics Pipeline
- Turning Analysis Into Fixes, Reply Experiments, and Reports
- Why Most Teams Get Low-Star Analytics Backward
- Get Your Low-Star Reviews Answered Without the Manual Grind
- Frequently Asked Questions
- Sources
What Is Low Star Review Analytics and Why Averages Miss the Real Story?
A 4.3 average sounds fine until you realize it's hiding a J-curve: mostly 5-star reviews, a thin middle, and a spike of 1-star reviews from people who had one specific, fixable experience. That shape tells a completely different story than a smooth bell curve centered on 3 stars, even if both produce similar averages.
Three distribution shapes show up constantly, and each implies a different fix:
- J-curve (bimodal, skewed high): happy customers and a distinct angry minority, often tied to one defect or one bad location
- Bimodal (two humps): two customer segments having very different experiences, sometimes by product version or by store
- Middle-heavy: broad, low-grade dissatisfaction with no single fixable cause, often the hardest pattern to resolve
Recency weighting matters just as much as shape. A platform showing your current rating is really showing a weighted blend that favors recent activity, so a burst of ten 1-star reviews this week can shift your displayed score faster than fifty scattered over the past year would. Google Play Console's rating and review documentation shows this directly: it tracks how themes and reply activity correlate with rating changes over rolling windows, not just lifetime totals.
Here's the part most teams miss: a small, severe cluster (say, 8 reviews about data loss or billing errors) often moves your displayed average more than 40 reviews complaining about a minor UI annoyance. Severity and recency compound. Frequency alone doesn't.
Research from the Spiegel Research Center analyzed star ratings across more than 40 product categories and found most products cluster between roughly 4.2 and 4.5 stars. That narrow band means small shifts matter enormously, and the review content, not the number, is what explains purchase behavior beyond the mean.
Which Metrics Should You Track for Low Star Review Health?
You don't need a data science team to instrument this. You need four numbers, checked on a schedule, with thresholds that tell you when to escalate.
- NRV Ratio: the percentage of reviews in a recent window (30, 60, or 90 days) rated 1 to 2 stars. A lower percentage is generally healthy; moderate levels are a yellow flag; and a high percentage signals a red flag worth an emergency triage.
- Recency-weighted rating delta: compare your rolling 30-day average against your lifetime average. A widening gap signals something recent is actively hurting you, not just legacy noise.
- Per-theme effect on rating: for each complaint cluster, estimate how much removing it would shift your average. This is what turns a complaint list into a priority list.
- Reviewer-weight signals: verified purchases and helpful-vote counts should carry more weight than anonymous, unverified one-liners.
| Metric | Healthy range | Escalation trigger |
|---|---|---|
| NRV Ratio (30 to 90 day window) | Low percentage | Above 30% |
| Rolling vs. lifetime rating delta | Close to lifetime average | Gap widening over 2+ weeks |
| Reviews needed for a reliable theme | 30+ reviews | Fewer than 30, treat findings as directional only |
| Reviews for robust clustering | 100 to 500 reviews | N/A, this is the target range |
That sample-size guidance isn't arbitrary. Voc puts the floor at around 30 negative reviews before a theme counts as repeatable, with 100 to 500 giving you clustering solid enough to rank confidently.
Sentiment Scores Alone Won't Tell You What to Fix
A sentiment model can tell you a review is negative. It can't tell you whether the customer is describing a broken feature, a missing feature, or a price they think is unfair. That distinction is the entire point of low-star review analytics, and it's why sentiment analysis and full review analysis are not the same discipline. Research distinguishing the two makes this explicit: sentiment scoring is a component, not a substitute, for the theme identification and defect classification that actually drives product decisions, as practitioner analysis on review methodology points out.
Aspect-based sentiment analysis (ABSA) solves this by tagging sentiment to specific aspects of the product or service, not the review as a whole. A single review might say "the technician was great but the invoice took forever," and ABSA scores those two aspects separately instead of averaging them into a meaningless "neutral."
Three techniques do most of the heavy lifting in practice:
- ABSA models tag sentiment per feature or service aspect, separating "great tech" from "slow invoice" in the same review
- Topic modeling (LDA or embedding-based clustering) groups semantically similar complaints even when the wording differs completely
- Named entity recognition (NER) pulls out specific product names, locations, or staff mentions so multi-location businesses can localize a problem instead of treating it as company-wide
Pro Tip: Run topic modeling before you eyeball anything. Complaints about "the app crashing" and "it keeps freezing" read as different problems to a keyword search but are the same cluster to an embedding model, and merging them prevents you from underestimating how big a problem actually is.
For volume under a few hundred reviews a quarter, an off-the-shelf sentiment API is fine. Past that, long-context LLMs earn their keep because they preserve narrative context, tying a complaint back to a specific app version or release date instead of treating every review as an isolated data point. Testing comparing ChatGPT and Claude on app review tasks found real trade-offs worth knowing before you pick a tool: one model tends to deliver more nuanced narrative grouping, while the other is faster and more precise on straight counts.
How Do You Turn Review Clusters Into a Prioritized Fix List?
Clustering only pays off if it ends in a ranked list someone acts on. Here's the workflow that gets you there without drowning in spreadsheets.
- Collect cleanly. Export 1 and 2 star reviews from the last 30 to 90 days, strip formatting, and keep plain text. Discard reviews under a handful of words unless they carry a rating outlier worth investigating separately.
- Set a frequency floor. Don't act on a cluster with fewer than 5 to 8 mentions unless the topic is safety-related, in which case act on any credible mention.
- Correlate clusters to releases. If a complaint cluster spikes right after a product update or a new hire started, that's your regression signal, and it's usually the fastest fix to find.
- Rank by impact, not volume. Use a formula weighting severity, recency, and reviewer credibility: a crash cluster from verified buyers this month outranks a cosmetic complaint cluster from two years ago, even if the cosmetic cluster has more total mentions.
- Write three deliverables per top cluster. One sprint ticket describing the fix, one explicit "don't do" (the fix that seems obvious but would break something else), and one public reply template addressing the theme without overpromising a timeline.
Pro Tip: Route anything involving a refund, safety issue, or legal threat to private outreach first. A public reply is for demonstrating you're listening; it is never the venue for negotiating compensation.
How Local Review Reply Fits Into a Low Star Analytics Pipeline
The full pipeline looks like this in practice: export reviews, normalize the text, run AI-assisted clustering and impact-ranking, generate a ticket and a draft reply for each priority cluster, route the draft through approval, then measure whether your rating moves. Most teams stall at the reply step, because drafting a thoughtful, on-brand response to every 1-star review, at scale, across multiple locations, is genuinely tedious work.
That's the layer Localreviewreply operates in. It drafts personalized replies to Google Business Profile reviews, with approval controls specifically for sensitive or low-star cases, so a franchise or agency team can review and edit before anything publishes rather than trusting AI output blind. For multi-location operators, that consistency matters: a reply tone that works for one location and embarrasses another is its own kind of damage.
Replies don't just look good. Google Play Console's own review data shows a measurable pattern where apps with reply activity see more instances of users updating their original rating upward than apps without replies.
That single data point, sourced from Google's own developer documentation, is probably the strongest argument for treating reply strategy as part of your analytics loop rather than an afterthought bolted onto it.
If you're building this pipeline from scratch, a few free resources help calibrate expectations before you commit to a platform:
- A Google review rating calculator to model how many new 5-star reviews offset a recent 1-star cluster
- A review removal and appeal checker for reviews that violate platform policy rather than reflecting a real complaint
- A Review Reply Benchmark comparing typical reply rates and response times across service categories
Turning Analysis Into Fixes, Reply Experiments, and Reports
A cluster becomes useful the moment it becomes a ticket someone can act on. Write acceptance criteria in plain terms ("checkout no longer times out on mobile Safari"), attach a repro path if the complaint is technical, and quote two or three representative reviews so engineering understands the customer impact, not just the bug.

Replies deserve the same rigor as any other product change. Run two reply templates for the same complaint theme across a comparable set of locations or time windows, then track which version correlates with more customers updating their rating afterward. Google's Play Console data already shows replies correlate with upward rating revisions industry-wide; your own A/B test tells you which tone does it better for your specific customers.
Three widgets make this reportable to people who don't want to read raw review text:
- NRV trendline: your negative review share over the last 6 to 12 rolling windows, so leadership sees direction, not just a snapshot
- Rating-impact waterfall: shows how much each fixed cluster is estimated to have contributed to your rating recovery
- Top clusters by effect on rating: a short, standing list, refreshed monthly, of the two or three themes worth the next sprint's attention
Report on a monthly cadence for most businesses, weekly only during an active triage after a release or a PR event. Weekly reporting on a quiet month just creates noise nobody reads.
For teams handling this manually across service categories, tools like Gleanit illustrate the gap between basic star tracking and genuine aspect-level review analysis, a useful reference point if you're deciding how much of this to build versus buy.
Why Most Teams Get Low-Star Analytics Backward
Most advice on negative reviews treats them as a reputation problem to manage. That's backward. A 1-star cluster is product feedback that happens to be published publicly, and the businesses that win long-term treat it exactly that way: as free, structured input into what to build next.
The overrated piece of conventional wisdom is volume-based prioritization, chasing whatever complaint has the most mentions. Severity beats volume almost every time. Eight reviews describing lost customer data will cost you more, faster, than eighty reviews complaining about a confusing menu layout, and teams that rank by count alone spend a quarter fixing the wrong thing.
What the research actually supports is a boring, disciplined loop: export, cluster, rank by impact, ship the top fix, reply publicly to show you're listening, then check whether the rating moved. Skipping the reply step is the second most common mistake. Google's own data shows replies correlate with rating updates, yet plenty of teams treat replies as customer service theater instead of a measurable lever.
Start with the metric, not the feeling. Check your NRV Ratio before you read a single review.
Get Your Low-Star Reviews Answered Without the Manual Grind
Once you've clustered your low-star reviews and ranked them by impact, someone still has to write the reply, for every location, every week, without sounding robotic or repetitive. That's where the analysis work usually stalls out for multi-location teams.
Localreviewreply drafts personalized, on-brand replies to Google Business Profile reviews in seconds, with approval controls built specifically for sensitive or low-star cases, so nothing publishes without a human checking it first. Franchise operators and agencies managing dozens of locations get consistent tone without a full-time reply team, and the approval workflow features let you set who reviews what before anything goes live. If you're running the clustering and ranking work described above, pairing it with review management software built for local businesses closes the loop between insight and response. Start a trial and connect your Google Business Profile to see how drafts handle your actual backlog of low-star reviews.
Frequently Asked Questions
What is low star review analytics, in one sentence? It's the process of extracting recurring themes from your 1 and 2 star reviews and ranking those themes by their estimated effect on your overall rating, so you fix the highest-impact problem first.
How many negative reviews do I need before the patterns are reliable? Around 30 reviews is the floor for spotting a repeatable theme, according to VOC.AI's methodology, with 100 to 500 giving you clustering solid enough for confident prioritization.
What's the NRV Ratio and why does it matter? It's the share of your recent reviews (typically a 30 to 90 day window) landing at 1 or 2 stars.
Does replying to negative reviews actually change my rating? Google Play Console's data indicates a measurable correlation between reply activity and customers updating their original rating upward, though a reply is not a guarantee any individual customer will change their score.
Should I use sentiment analysis or full review analysis? Sentiment analysis alone only tells you tone. Full review analysis, including aspect-based tagging and theme clustering, tells you what specifically to fix, which is the input you actually need for a sprint ticket.
Sources
- Star Ratings and Review Content - Spiegel Research Center
- View and analyze your app's ratings and reviews - Play Console Help
- Voc
- ChatGPT vs Claude: App Review Analysis Tested (2026) | Unstar