
The eight review response KPIs that matter most are: overall response rate, negative-response rate, average response time, under-1-hour rate, rating trend, sentiment index, review velocity, and outcome review completion. Track those eight and you have a complete picture of both your public-facing performance and your internal workflow health.
Here is the shortlist with the single most important measurement for each:
- Response rate (overall): reviews replied to / total reviews received × 100
- Negative-response rate: negative reviews replied to / total negative reviews × 100 (target: 95–100%)
- Average response time: mean hours from review posted to reply published
- Under-1-hour rate: reviews replied to within 60 minutes / total reviews × 100
- Rating trend: change in average star rating across a fixed reporting window (monthly)
- Sentiment index: net positive sentiment score across all reviews in the window
- Review velocity: new reviews received per week or per month
- Outcome review completion: actions with a completed outcome review / actions whose review date has passed × 100
The core principle: A high response rate with no measurement of speed, sentiment, or follow-through tells you almost nothing about whether your program is actually working. Track all eight, show counts alongside every percentage, and use fixed reporting windows so your trend lines mean something.
The sections below define exact formulas, denominators, reporting windows, SLA targets, and workflow KPIs that turn these eight numbers into a functioning measurement program.
Key Takeaways
Responding to reviews without measuring speed, coverage, and follow-through is the fastest way to build a program that looks active but produces no learning.
| Point | Details |
|---|---|
| Start with eight core KPIs | Track response rate, negative-response rate, median response time, 90th percentile response time, under-1-hour rate, rating trend, sentiment index, and review velocity. |
| Always show counts with percentages | A 95% response rate on 20 reviews is not the same signal as 95% on 400; display the count every time. |
| Use percentiles, not averages, for response time | Report median and 90th percentile response time; the mean hides slow outliers that represent real customer experiences. |
| Add workflow KPIs from month one | Traceability rate, triage SLA attainment, and outcome review completion show whether responses drive decisions, not just replies. |
| Localreviewreply centralizes this at scale | The platform handles AI-drafted replies, approval workflows for sensitive reviews, and multi-location KPI tracking in one dashboard. |
Table of Contents
- Core review response KPIs: definitions, formulas, and worked examples
- How to measure consistently: windows, denominators, and data hygiene
- Deeper operational workflow KPIs that show whether responses drive decisions
- How to set realistic SLA targets for review response
- What to put on a review-response dashboard
- Measurement mistakes that make your KPIs misleading
- What to measure first: a 90-day rollout perspective
- Fewer manual hours, more consistent replies at scale
- Sources
Core review response KPIs: definitions, formulas, and worked examples
Every team defines these metrics slightly differently, which is exactly how comparisons break down. The formulas below use explicit denominators so your measurement is replicable across platforms.
Response rate and negative-response rate
Response rate = (reviews replied to ÷ total reviews received in window) × 100
Negative-response rate = (negative reviews replied to ÷ total negative reviews received) × 100
This is the metric that actually moves outcomes. Benchmarks from ASO research show top performers reply to 70–90% of negative reviews within 24 hours, and responding to negatives is associated with a 15–25% greater likelihood of a user revising a rating upward. Track negative-response rate separately from overall response rate.
Average response time, median, and percentile response times
Average (mean) response time = sum of hours from review posted to reply published ÷ number of replies
The mean is useful for trending but misleading when a handful of very slow replies skew it. A location with 19 replies in under two hours and one reply at 72 hours will show a mean of roughly 5.5 hours, which looks worse than the reality for most reviews.
Use median response time (50th percentile) as your primary speed metric and 90th percentile response time as your SLA ceiling. That is the number to put in front of leadership.
Practitioner evidence shows that responding within one hour correlates with substantially higher issue resolution and rating-update rates compared to multi-day delays. Speed is not just a courtesy metric.
Under-1-hour rate
Under-1-hour rate = (reviews replied to within 60 minutes ÷ total reviews received) × 100
This is the most sensitive leading indicator for high-impact negative reviews. Set it as a separate KPI for the subset of reviews flagged as urgent (health, safety, legal, or active-harm mentions) rather than applying it to all reviews, where it is an unrealistic target for most teams.
Rating trend
Rating trend = current period average star rating minus prior period average star rating

Report monthly. A location sitting at 4.1 stars that was at 3.9 stars three months ago is improving. One sitting at 4.1 that was at 4.4 is declining. The absolute rating matters less than the direction and rate of change.
Sentiment index
A sentiment index normalizes review text into a single score. The simplest method: assign +1 to positive reviews, 0 to neutral, and -1 to negative, then calculate the net score as a percentage of total reviews. More sophisticated implementations use NLP-based sentiment scoring at the sentence level, which surfaces mixed reviews that a star-rating alone would misclassify.
Report sentiment trend alongside rating trend. A rising star rating with a declining sentiment index often signals that recent reviews are shorter and less detailed, which can indicate review solicitation without genuine experience improvement.
Review velocity and recency
Review velocity = new reviews received per reporting window (week or month)
A sudden spike in velocity can signal a viral complaint, a competitor attack, or a successful review-request campaign. A sustained drop in velocity often precedes a rating decline because older reviews age out of Google's recency weighting. A monthly review health score that combines rating trend, recency, velocity, and response performance gives operators a single operating signal rather than five separate charts to reconcile.
Outcome review completion
Outcome review completion = (actions with a completed outcome review ÷ actions whose review date has passed) × 100
This is the workflow KPI that closes the loop. It measures whether your team actually went back and verified that a promised fix happened. Without it, your response rate looks great while the same complaint recurs every month.
KPI reference table
How to measure consistently: windows, denominators, and data hygiene
The most common reason KPIs mislead teams is not bad data. It is inconsistent measurement rules applied to good data.
Fixed reporting windows
Use weekly windows for flow metrics (review velocity, under-1-hour rate, new review count) and monthly or quarterly windows for outcome metrics (rating trend, sentiment trend, outcome review completion, resolution rate). Mixing windows creates false comparisons. A response rate calculated over a rolling 7-day window will look different from one calculated over a calendar month, even with identical underlying performance.
Percentile response times need enough volume to be meaningful. A 90th percentile calculated from eight replies is not a reliable SLA signal.
Denominator visibility
- Always display the raw count next to every percentage.
- Flag any percentage based on fewer than 30 reviews in the window as low-confidence.
- Never report a platform-level KPI that combines Google, Yelp, and Facebook reviews without a separate breakdown by platform.
Show both numbers every time.
Percentiles over averages
For response time, report median and 90th percentile as your primary metrics. The mean is available for trending but should never be the headline number. Response time distributions are almost always right-skewed: most replies go out quickly, and a small number of forgotten or escalated reviews drag the mean upward. The 90th percentile tells you what your worst-case experience looks like for nine out of ten reviewers.
Platform consolidation without double-counting
When consolidating Google, Yelp, Facebook, and other platforms into a single dashboard, assign each review a unique platform-review ID before aggregating. The most common double-counting error occurs when a review is exported from two different tools (a CRM and a standalone review platform) and counted twice in the denominator.
Pro Tip: Build your consolidated view from a single data source with a deduplication key, not from exports of two separate tools merged in a spreadsheet. One source of truth prevents the "our numbers don't match" conversation every reporting cycle.
Deeper operational workflow KPIs that show whether responses drive decisions
Public-facing KPIs tell you what reviewers see. Workflow KPIs tell you whether your team is actually learning from feedback and closing the loop on promises made in replies.
The Voc recommends starting with five KPIs before adding the full 12-metric suite. Those five are: traceability rate, triage SLA attainment, investigation cycle time, owner-and-date coverage, and outcome review completion.
The workflow funnel
Every review passes through a series of stages. Measuring conversion between stages shows you exactly where your process breaks down.
| Stage | Count label | Derived metric |
|---|---|---|
| Received | Total reviews in window | Baseline |
| Traceable | Reviews linked to a customer record or ticket | Traceability rate |
| Triaged | Reviews assigned a priority tier within SLA | Triage SLA attainment |
| Investigating | Reviews with an active owner and open investigation | Investigation cycle time |
| Decided | Reviews with a documented decision | Decision rate |
| Owned | Decisions with a named owner and due date | Owner-and-date coverage |
| Verified | Actions with a completed outcome review | Outcome review completion |
Each row needs a count, not just a percentage.
The five starting workflow KPIs
Traceability rate = (reviews linked to a customer record or ticket ÷ total reviews received) × 100. This is the gateway metric. If you cannot link a review to an experience, you cannot investigate it or close the loop.
Triage SLA attainment = (reviews triaged within SLA ÷ total reviews requiring triage) × 100. Triage means assigning a priority tier (urgent, high, standard) within your defined window. A review that sits unclassified for 48 hours has already missed its response window.
Investigation cycle time = median hours from triage to a documented decision. Long cycle times usually point to unclear ownership, not slow investigators.
Owner-and-date coverage = (decisions with a named owner and a due date ÷ total decisions made) × 100. A decision without an owner is a wish. This metric enforces accountability.
Outcome review completion = (actions with a completed outcome review ÷ actions whose review date has passed) × 100. This is the closing metric. It measures whether the team went back, confirmed the fix, and documented the result.
Pro Tip: Keep customer-experience outcome metrics (rating trend, sentiment index, CSAT) separate from workflow-health metrics (triage SLA attainment, owner-and-date coverage) in your reporting. Connect them at the decision record level: when a workflow action closes, tag the associated review and check whether the rating changed. That linkage is where the learning happens.
How to set realistic SLA targets for review response
SLA targets should reflect the risk level of the review, not a single blanket standard. A one-star review mentioning a food safety issue and a four-star review with a minor complaint about parking are not the same operational priority.
Recommended SLA tiers
- Under 1 hour: Reviews mentioning active harm, health or safety risks, legal threats, or public crises. These require immediate human review before any reply goes out.
- Under 4 hours: High-impact negative reviews (1–2 stars) with specific complaints about service, product quality, or staff. These are the reviews most likely to influence a prospective customer reading them in the next few hours.
- Under 24 hours: All other negative reviews (3 stars or below). Top performers respond to 70–90% of negative reviews within this window.
- 48–72 hours: Positive reviews (4–5 stars). Responding to positives builds goodwill and signals engagement to both reviewers and prospects, but they carry lower urgency.
Percentile-based SLA reporting
State SLA targets as percentile thresholds, not averages. "90th percentile response time under 24 hours for negative reviews" is a defensible, measurable commitment. "Average response time under 12 hours" is not, because a few very fast replies can make the average look fine while a quarter of your reviews sit unanswered for days.
Exception handling
- Reviews from repeat complainants or known escalation accounts: route to a senior owner within the standard SLA, not a faster one, unless the content warrants it.
- Legal or health mentions: require human approval before any reply publishes, regardless of whether a draft was generated automatically.
- Low-evidence reviews (no detail, no context): a shorter, templated acknowledgment is appropriate; do not invest investigation time without a traceable complaint.
Reviewing and tightening SLA targets
Review SLA attainment monthly for the first quarter. SLA targets that never get tightened stop driving improvement within two or three quarters.
- Start with targets your current team can hit 80% of the time.
- Publish attainment rates alongside the targets so the gap is visible.
- Assign a named owner for every SLA breach within 24 hours of the breach occurring.
What to put on a review-response dashboard
A useful dashboard shows the right person the right metric at the right time. The most common failure is building a dashboard that displays everything and prioritizes nothing.
Dashboard blueprint
| Layer | Metrics to display | Visualization |
|---|---|---|
| Top-line health | Review health score, overall rating, rating trend | Single score with trend arrow |
| Flow metrics | New reviews this week, review velocity trend | Bar chart by week |
| Response performance | Response rate, negative-response rate, median and 90th percentile response time | KPI tiles with sparklines |
| Outcome metrics | Rating trend (monthly delta), sentiment index, outcome review completion rate | Line charts |
| Workflow funnel | Stage counts (Received → Verified), SLA attainment by tier | Funnel visual with SLA attainment % |
| Platform breakdown | Response rate and avg. response time by platform | Side-by-side bar chart |
Visualization choices that matter
Use sparklines for trend metrics so the direction is visible without requiring a click. Use percentile strips (a horizontal bar showing 25th, 50th, 75th, and 90th percentile response times) rather than a single average for response time. Funnel visuals for stage conversions make drop-off points immediately obvious to anyone who glances at the dashboard, including ops managers who are not reading the underlying data.
Drilldowns should filter by location, platform, time window, and reviewer sentiment. For multi-location operators, the default view should be the portfolio level with a one-click drill to any individual location.
Pro Tip: Place the most actionable metric first: overdue high-impact negatives that have not yet been claimed by an owner. If an ops manager opens the dashboard and the first thing they see is "3 urgent reviews unowned for more than 2 hours," they will act. If they see a summary chart, they will read it and close the tab.
Refresh cadence: flow metrics (velocity, under-1-hour rate) should update at least daily. Outcome metrics (rating trend, sentiment index) update monthly. SLA attainment reports run weekly.
Measurement mistakes that make your KPIs misleading
The most dangerous KPI is one that looks healthy while hiding a real problem.
Red flag pattern: A 95% response rate on 20 reviews last month, a median response time of 1 hour, but a 90th percentile response time of 7 days. The median looks excellent. The 90th percentile reveals that one in ten reviewers waited a week for a reply. Reporting only the median would have hidden that entirely.
Common pitfalls and quick fixes
Missing denominators. A response rate without a review count is uninterpretable. Fix: mandate that every percentage in every report shows the underlying count in parentheses.
Fix: flag any metric based on fewer than 30 events as low-confidence and exclude it from trend comparisons.
Mean instead of percentiles for response time. One 72-hour reply can shift the mean by hours. Fix: switch to median and 90th percentile as primary metrics; keep the mean only for long-term trending.
Fix: always break down response rate and response time by platform before rolling up.
Conflating speed with resolution. A fast reply that does not address the complaint is not a resolution. Fix: track outcome review completion separately from response time and report both.
Reporting percentages without counts. This is the single most common way a review-response program looks better on paper than it performs in practice. Fix: make count-alongside-percentage a non-negotiable reporting standard across every dashboard and every stakeholder report.
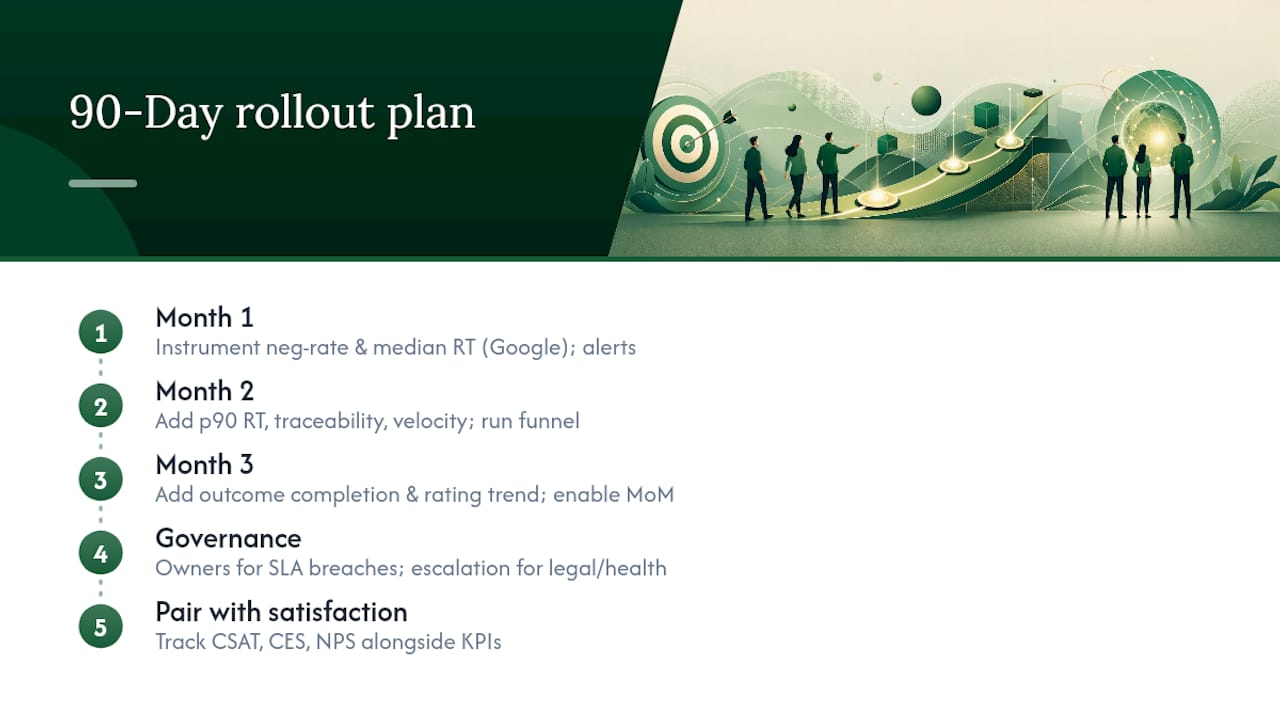
What to measure first: a 90-day rollout perspective
Most teams that try to instrument all eight public-facing KPIs and five workflow KPIs simultaneously end up with a dashboard nobody trusts and data nobody acts on. The better approach is to start narrow, prove the measurement works, and add metrics only when you can name the decision they will inform.
Month 1: Instrument negative-response rate and median response time for Google reviews only. Set up real-time alerts for new reviews so discovery is consistent. Assign a named owner for every negative review within your triage SLA. Publish one dashboard with counts alongside every percentage.
Month 2: Add 90th percentile response time, traceability rate, and review velocity. Run your first workflow funnel report, even if some stage counts are estimates. Identify the biggest drop-off point in the funnel and assign an owner to fix it.
Month 3: Add outcome review completion and rating trend. By this point you have enough data to run a meaningful month-over-month comparison.
Governance matters from day one. Assign a named owner for every SLA breach. Define an escalation path for legal and health mentions before you need it. Tie KPI changes to specific experiments: if you change your triage process in week 6, note the date in your dashboard so you can attribute any metric shift to the change rather than noise.
Pairing your review-response KPIs with broader satisfaction measures, including CSAT, CES, and NPS, is what connects response performance to customer outcomes. Zendesk's guidance on measuring customer satisfaction recommends mixing direct feedback methods with operational metrics like first response time and resolution time, which maps directly to the KPI framework above.
Fewer manual hours, more consistent replies at scale
Tracking these KPIs is straightforward when your team is managing a handful of locations. At 10, 20, or 50 locations, the manual overhead of monitoring new reviews, drafting replies, routing sensitive ones for approval, and updating a funnel dashboard becomes the bottleneck.
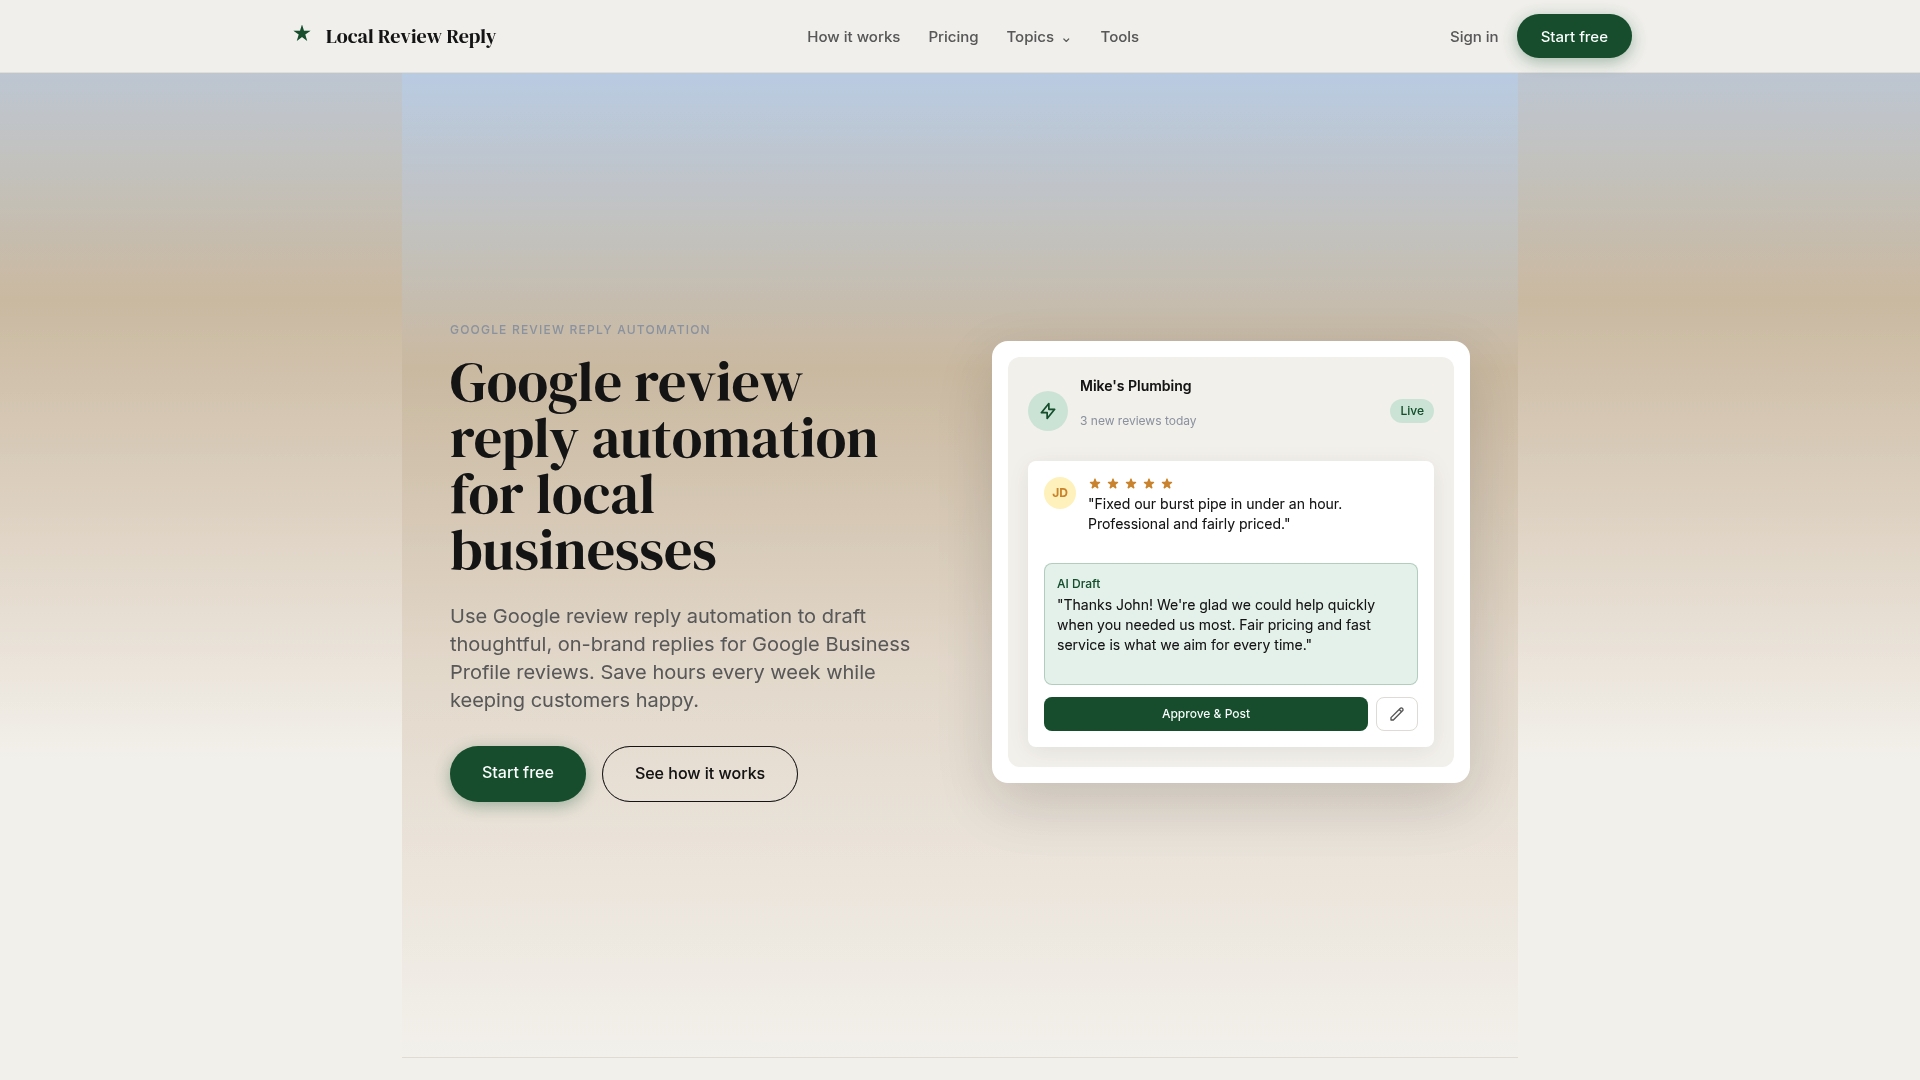
Localreviewreply is built for exactly that scale. It drafts personalized, on-brand Google review replies in seconds, routes low-star and sensitive reviews through an approval workflow before anything publishes, and gives multi-location operators and franchise teams a centralized view of response performance across every location. The platform maps directly to the KPIs in this guide: alerts for new reviews to protect your under-1-hour rate, SLA tracking to surface overdue responses, and location-level breakdowns so platform differences do not hide in an aggregate number.
Marketing agencies managing review programs for multiple clients will find the white-label and multi-location reply management features particularly relevant. Automated drafting handles volume; human approval handles risk. Start a free trial to see how the workflow maps to your current measurement setup.
Sources
For teams building out a full measurement program, these sources cover both the public-facing benchmarks and the operational workflow framework referenced throughout this guide.
- Voc
- Review Response Time: Why Speed Matters and How to Get Faster | MentionReview Blog - MentionReview
- Review Response Rate — ASO Wiki | ASOtext
- How to measure customer satisfaction | Zendesk
- Review Health Score: The Metrics You Should Track Every Month | OrderBoosts